
In the fast-paced world of e-commerce, data is your best friend. It helps you understand customer behaviors, track sales trends, and fine-tune your marketing strategies. But let’s face it: manually generating reports can take time and resources. That's where automated reporting comes to the rescue. Integrating automated reporting tools with your e-commerce platform allows you to streamline data analysis and make smarter, data-driven decisions.
How E-Commerce and Reporting Work Together
E-commerce and data reporting are like peanut butter and jelly – they work better together.
Reporting tools gather data from various sources, analyze it, and present it in an easy-to-understand format. This synergy lets you quickly identify what's working and what needs improvement in your e-commerce strategy.
When you take it to another level and automate that reporting, you ensure you stay on top of trends, adapt to changes, and optimize your business growth without spending endless hours analyzing data.
Top KPIs to Track for E-Commerce
As previously mentioned, reporting is crucial for e-commerce success, but targeting the proper metrics is essential. Without focusing on key performance indicators (KPIs), you can easily get lost in a sea of data, making it difficult to gain insights.
Here are some of the top KPIs every online store should monitor when wanting to automate their e-commerce reporting:
Sales Metrics
Revenue: Revenue is the total income generated from sales. Monitoring revenue helps you gauge your store's financial health and overall performance. If you notice a dip in revenue, you can investigate potential issues such as website problems, ineffective marketing campaigns, or low inventory levels. On the other hand, a revenue spike might indicate successful promotions or seasonal trends.
Average Order Value (AOV): This metric represents the average amount customers spend per transaction. A higher AOV suggests that customers purchase more or higher-priced items per order. You can use this data to create strategies encouraging customers to add more items to their cart, such as bundling products, offering discounts on larger orders, or implementing a free shipping threshold.
Sales Conversion Rate: This is the percentage of website visitors who complete a purchase. A low conversion rate may indicate issues with your website's user experience, such as a complicated checkout process, slow loading times, or unclear product descriptions. You can increase your conversion rate and boost sales by improving these areas.
Number of Transactions: Tracking the total number of transactions gives you insight into the volume of sales happening over a specific period. Analyzing this data lets you identify peak times and plan inventory and staffing accordingly. Additionally, you can use this information to evaluate the success of marketing campaigns and promotions, adjusting your strategies to maximize the number of transactions.
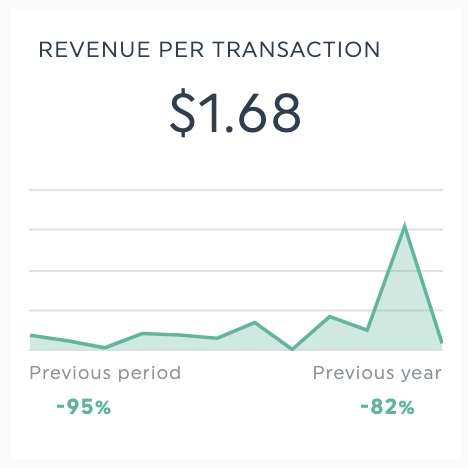
Source: Dashthis dashboard (screenshot provided by author)
Alt text: Revenue per transaction
Customer Metrics
Conversion Rate: This is the percentage of visitors who complete a purchase on your site. A low conversion rate might indicate issues like a complicated checkout process, unclear calls-to-action, or unappealing product pages. You can improve your conversion rate by optimizing your website design, simplifying the checkout process, and ensuring clear product descriptions and images.
Traffic Sources: This metric shows where your visitors are coming from, such as search engines, social media, direct traffic, or referral links. Understanding traffic sources helps you identify which marketing channels are most effective. For example, if you see high traffic from social media but low conversions, consider refining your social media strategy or targeting different audience segments.
Bounce Rate: The bounce rate indicates the percentage of visitors who leave your site after viewing only one page. A high bounce rate could suggest your landing pages are not engaging or relevant to your visitors’ interests. You can use this data to improve your content, ensure your landing pages align with your visitors' expectations, and enhance the overall user experience to keep visitors engaged and encourage them to explore more pages.
Average Session Duration: This metric tracks visitors' time on your site. Longer session durations generally indicate that visitors find your content engaging and valuable. If your average session duration could be higher, consider improving your content, adding more engaging multimedia elements, or offering personalized product recommendations to keep visitors on your site longer.
Website Metrics
Conversion Rate: This metric measures the percentage of visitors who purchase. A low conversion rate might indicate issues such as a complicated checkout process, unclear calls to action, or subpar product pages. Optimizing website design, simplifying the checkout process, and ensuring clear product descriptions and images can improve conversion rates.
Traffic Sources: Knowing where your visitors come from (e.g., search engines, social media, direct traffic) helps you optimize marketing channels. For instance, if social media drives significant traffic but low conversions, refine your strategy or target different audience segments. Allocate marketing budgets to channels with the highest ROI.
Bounce Rate: The bounce rate indicates the percentage of visitors who leave your site after viewing only one page. A high bounce rate may suggest your landing pages aren’t engaging or relevant. Use this data to improve your content, ensure your landing pages align with visitor expectations, and enhance the user experience to encourage further exploration.
Average Session Duration: This metric tracks visitors' time on your site. Longer session durations generally indicate engaging and valuable content. If the average session duration is low, consider enhancing your content, adding multimedia elements, or offering personalized product recommendations to keep visitors engaged longer.
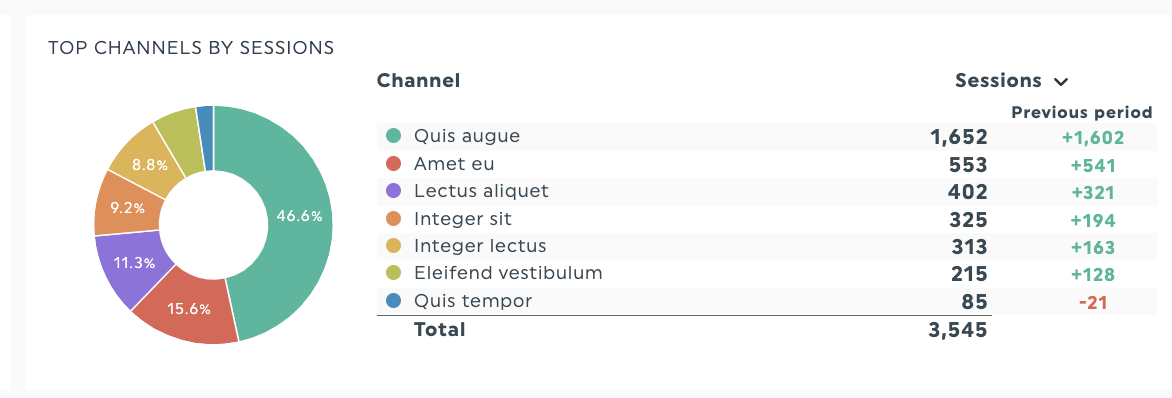
Source: Dashthis dashboard (screenshot provided by author)
Alt text: Top channels per session
Product Performance Metrics
Top-Selling Products: Identifying your best-selling products helps you allocate marketing resources effectively. If certain products consistently outperform others, consider featuring them prominently on your homepage or email campaigns. Knowing your top sellers can also inform your inventory management, ensuring you always have enough stock to meet demand.
Inventory Turnover Ratio: This ratio measures how quickly your inventory sells and is replaced over a specific period. A high inventory turnover indicates strong sales, while a low ratio may suggest overstocking or unpopular products. Use this data to adjust your purchasing strategy, avoiding excess stock and focusing on quickly moving items.
How to Track These Crucial Metrics
Tracking these KPIs might sound daunting, but it can be a breeze with the right tools. Here are some tips on how to effectively monitor your e-commerce metrics:
Use Data Analytics Tools: Platforms like Google Analytics and OpenCart Analytics track website and customer metrics. They provide detailed marketing reports and insights into visitor behavior and sales performance.
Set Up Tracking with UTM Parameters: UTM parameters help you track the effectiveness of your marketing campaigns by appending specific tags to your URLs. This way, you can see which campaigns are driving traffic and conversions.
Integrate E-Commerce Data with Reporting Tools: To get a comprehensive view of your e-commerce performance, integrate your e-commerce data with a reporting tool like Dashthis. It lets you pull data from multiple sources into a single, easy-to-read dashboard.
Saving Time with Automated Reporting
Let’s talk about the elephant in the room – manual reporting is time-consuming and prone to errors. Automated reporting, on the other hand, saves you precious time. Here’s why you should consider switching to automated reporting:
Efficiency: Automated reporting tools pull data from various sources and compile it into a one coherent report, eliminating the need for manual data entry.
Accuracy: Automated systems can help reduce the risk of human error. The data is pulled directly from your sources and updated in real time
Consistency: With automated reporting, you can ensure that your reports are always up-to-date and consistent, enabling you to make informed decisions based on the latest data.
How to Create a Report with DashThis
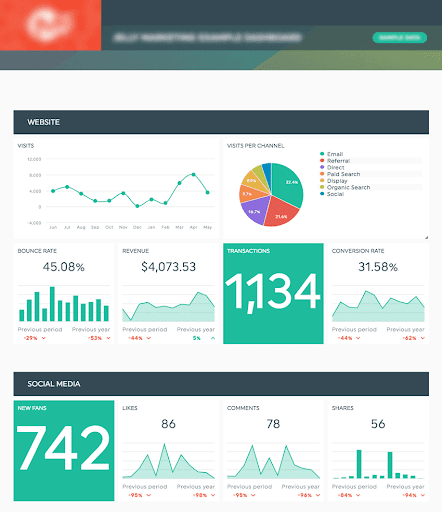
Source: Dashthis dashboard (screenshot provided by author)
Alt text: Digital Marketing Report Template
DashThis is an intuitive tool that simplifies the reporting process. Here’s a step-by-step guide to creating a digital marketing report with DashThis:
1. Sign Up and Set Up Your Account
Creating a DashThis Account: Go to DashThis and sign up for an account. The process takes just a few minutes.
Connecting Your Data Sources: Once you’ve set up your account, connect your data sources, such as Google Analytics, e-commerce platforms, email marketing and social media accounts. DashThis offers over 30 integrations.
2. Choose a Template or Custom Report
Selecting from Pre-Built Report Templates: DashThis offers a variety of templates tailored for e-commerce reporting.
3. Select Your KPIs and Metrics
Adding Widgets: DashThis uses widgets to display data. Add widgets for each KPI you want to track, such as revenue, conversion rate, and top-selling products.
Customizing the Presentation of Data: Customize the layout and design of your widgets with data visualization to make the report visually appealing and easy to understand.
4. Automate and Schedule Your Reports
Scheduling Email Delivery of Reports: Set up a schedule for DashThis to email reports to you and your team. Depending on your needs, you can choose daily, weekly, or monthly reports.
Conclusion
Combining e-commerce with automated reporting can significantly enhance your business insights and decision-making capabilities. Tracking essential KPIs and leveraging tools like Opencart and Dashthis can save time, reduce errors, and make data-driven decisions that drive growth. Don’t wait – start optimizing your e-commerce reporting today!

Login and write down your comment.
Login my OpenCart Account